Here is the promised continuation of my previous post, “Mike Wallace, Man of Mystery,” in which I compared Mike Wallace’s stats in his first three years to a number of receivers drafted after 1995 who had similar early success. The original intention for this post was to try to project Wallace’s value over the next few years.
However, there have been at least several thousand words written about the Mike Wallace situation by various of the other writers on this fine blog since that first article was published. As a result I decided to make this follow-up a more general look at the career trajectory for receivers taken at various levels in the draft.
For the original post I chose 100 receivers drafted or signed as a UDFA between 1994 and 2009, out of around 520 drafted during that time. Most of the receivers I chose had early success in the NFL. Out of those 100 I looked at 27 players whose initial three years resembled Mike Wallace’s the most closely, and added in Hines Ward for interest.

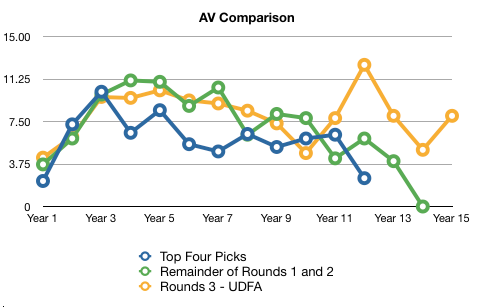
The Top Four Picks line is a result of averaging the career results for eight receivers, Braylon Edwards, Kevin Dyson, Ike Hilliard, Plaxico Burress, Johnnie Morton, David Boston, Javon Walker, and Santana Moss. (For the purposes of comparison I assumed the two years Plaxico Burress was, shall we say, otherwise engaged didn’t occur, and moved his 2011 numbers back to 2009.)
The Round One and Two line is an average of the career results for Peerless Price, Eric Moulds, Reggie Wayne, Roddy White, Chad Ochocinco, Chris Chambers, Bobby Engram, and Vincent Jackson. The Rounds Three – UFDA line is an average of the career results for Hines Ward, Steve L. Smith, Terrell Owens, Marty Booker, Laveranues Coles, Antonio Freeman, Jerricho Cotchery, Donald Hayes, Az-Zahir Hakim, T. J. Houshmandzadeh, Wes Welker, and Rod Smith.
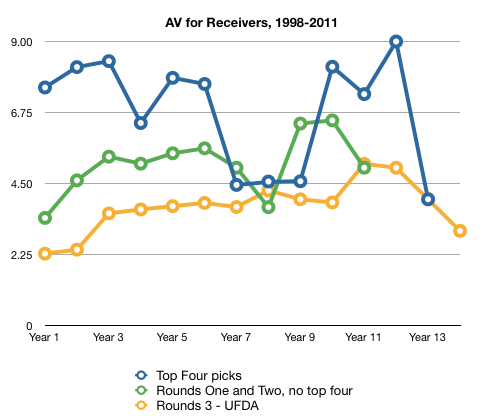
Now let’s turn it upside down, as it were, and look at these same receivers, except this time we will look at their Approximate Value (hereafter AV) as per Pro-Football-Reference. (You can find an explanation of the Approximate Value on their website.) It’s upside down because in the NFL stats low is better, but for the PFR stats high is better.
The PFR plots are less “noisy” because they have constrained the numbers a good bit. A banner year for a receiver would give him an AV of +10, and the highest number I saw for anyone was less than 20. The NFL rankings go up to about 170 or so, depending on the year.
If you look at either chart, though, it looks as if the best long-term results were actually with the lower-round picks. But I also realized I was very much cherry-picking in the low rounds in particular. So I went back to the spreadsheets and entered the data for all receivers drafted between 1998 and 2007. (I stopped at 2007 to give everyone at least five years in the league before looking at their numbers, and I stopped at 1998 because I was going nuts…)
I decided to stick with the PFR numbers, and entered those for everyone drafted between 1998 and 2007. I then went through the lists for each year and removed the names of the guys who just didn’t work out. I took their name off the list if they both had a WCAV of less than five and they had a career of three seasons or less. (By way of comparison, Hines Ward’s AV just for 2011, one of his worst seasons, was 3.) I figure that anybody whose accumulated AV career score is less than five, and yet still persuade a team to sign them for additional years, must have something going for them that isn’t showing up in the rankings.
Before we look at the results, let’s look at some overall information.
The total number of players drafted between 1998 and 2007, including any UDFAs who stuck in the league long enough to generate some stats, was 349. That’s an average of almost 35 players per year.
The total number of players I removed for non-performance, if you will, was 136, or 39% of the total, leaving an average of 61% of players who pan out to some extent. The best percentage for any season was in 2003, at 67% retained. The worst two were 1998 and 2006, when only 56% of the players worked out well for the team drafting them.
So now let’s run the above chart again, but this time with only the lowest performers removed. This gives us about 2/3 of the total players to look at, as opposed to about 1/5 in the chart above.
The results now look a lot like you would expect during the first several years, when the mediocre players drag down the averages for Round 3 – UFDA in particular.
The first few years really reinforces the Advanced NFL Stats guys contention about the difference between top-four picks and everyone else. But an interesting thing happens around Year Seven. The receivers who are still playing at this point have evened out to a great extent. I’m not sure the curves at the very end of the graph are all that meaningful, because by that point only a few players are creating the stats.
Which brings to mind another interesting question—what is the average career, and does it vary by my somewhat arbitrary divisions? I don’t know. And to find out in a meaningful way I have to add the bottom third of low or non-performers back into the equation. So this may take a minute…
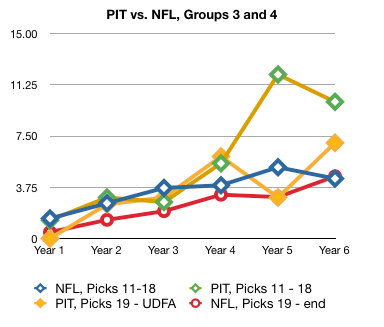
Here’s what I found. For this chart I divided the receivers a bit further, this time strictly by pick number, and the rest of the charts in this post will be divided this way. I kept the top four as Group 1. The next group are the fifth through tenth receivers picked in their draft. Group 3 is the eleventh through the eighteenth picks, and the last group is everyone else, minus the UDFAs. (Since the UDFAs that have a good career are outliers, for this purpose I’ve removed them from the equation, since it’s pretty well impossible to get information on the offsetting UFDA receivers who didn’t pan out.)
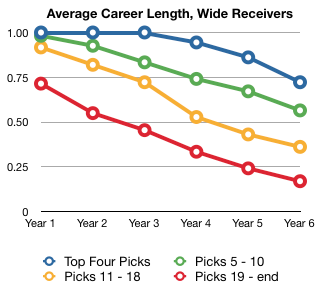
Once again, as you might expect the higher picks are likely to stay in the league longer. With the new CBA rules it seems to me the years of maximum interest to a front office are going to be the first four or five. So once again let’s see what the numbers look like, but this time with everyone.
The next chart is the average PFR Approximate Value, averaged by draft segment, for all the receivers chosen between 1998 and 2006, 2006 being the last year a receiver could have theoretically played six years.

Notice once again if a low pick (19 or lower) sticks long enough things even out a great deal. But nonetheless there is no getting around the facts—if you want a receiver to give you an immediate impact you generally have to take them at the very top of the draft, or spend a lot of money in free agency. Neither of these are preferred tactics for the recent Steelers organization. The other option is to get lucky.
If I was looking to get lucky I think I would take a chance on some of the guys picked as the eighth to the fifteeth receiver in a draft. You are always going to have the outliers in the lowest rounds and undrafted, like Antonio Brown or Wes Welker, but you have a good chance of getting a serviceable receiver in the eight to fifteen range, and maybe better than serviceable. Mike Wallace was the 11th pick in the 2009 draft. Hines Ward was the 14th pick in the 1998 draft. Both of them are clearly outliers—they have performed at far above their expected value.
And out of curiosity, how did the Steelers do at picking receivers during the time period we’ve been discussing—1998 – 2006? The Steelers made a lot more top-four picks than I would have guessed: three, in fact, Santonio Holmes, Plaxico Burress, and Troy Edwards. (That is three out of the 36 top four receivers during the nine-year period, or over 8%. Pittsburgh represents 3% of the league.) They also made three 2nd-tier picks, D’Wayne Bates, Antwaan Randle El, and Willie Reid. They made four 3rd-tier picks, and struck black and gold on Hines Ward, in addition to Fred Gibson, Malcolm Johnson, and Danny Farmer. Finally, there were only two end of the draft picks, both pretty much total busts: Lee Mays and Chris Taylor. Nate Washington was a UDFA who made things look much better in that category. I probably shouldn’t have included him, but the bottom line is too depressing otherwise…
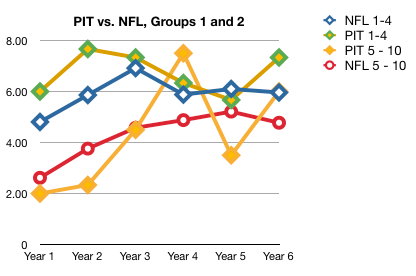
The Steelers look slightly better than the rest of the league, but given the number of high picks they should look better than this. However, things have changed for the better since 2006. Santonio Holmes had his flaws, but he was a great receiver, and the Steelers got great value out of him for three years. Since 2009 they have found three bargain-barrel receivers who make up one of the most exciting receiving corps in the league. For the moment, anyhow.
Finally, to return to the original Mike Wallace question for a moment, how have similar receivers turned out as they continued beyond the third year of their career? Quite well, in fact, although interestingly there tends to be a slight dip in production after the third season. Have a look at the final chart, I promise. It’s pretty “noisy” but you get the general idea:

There is good reason to believe that, barring some unfortunate occurrence, Mike Wallace should continue to produce at a high level. But the fact is, there isn’t really enough data to come to a firm conclusion, because what Mike has done in his first three years is quite unusual.
The Moneyball way to deal with this? The Steelers squeeze the value out of Wallace this year and let him walk next year. I don’t think that’s what the Front Office is hoping to do. That may be what happens, though, because they don’t have a choice. But it has been a great three years. I’m hoping there will be more.
Source: Behind the Steel Curtain
Need Steelers Tickets? Fulfill your ticket needs at Ticket Network or try our Steelers eBay Ticket Page.